


PRESIDENT'S MESSAGE
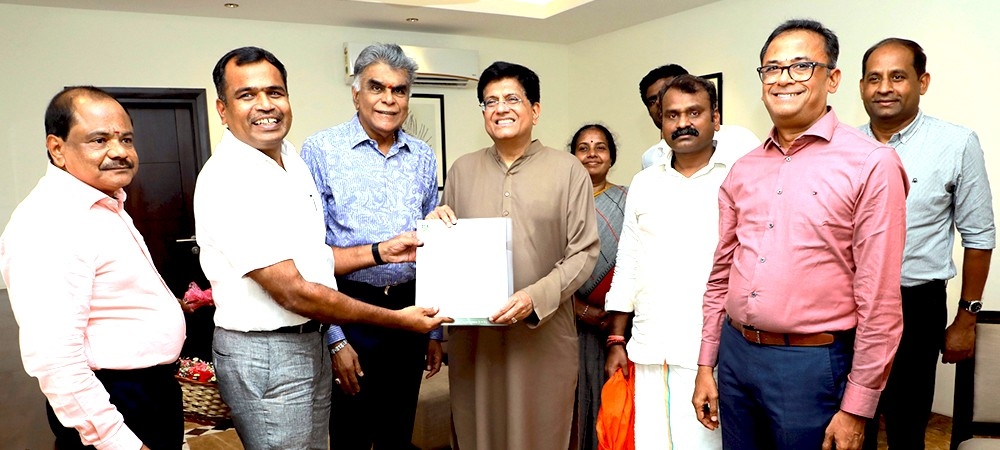
The India–New Zealand Free Trade Agreement (FTA), was signed between Hon’ble Minister for Commerce & Industry, Government of India Shri Piyush Goyal and Hon. Todd McClay, Minister for Trade and Investment, New Zealand on 27th April, 2026.
The forward-looking agreement is a major boost for India’s apparel exporters. With 100% duty-free access to the New Zealand market.... Read More
SUPPLIERS
>> Apparel Fashion Institutions
>> Accessory
>> Airline Services
>> Bank & Insurance
>> Buying Houses
>> Cargo & Freight Forwarders
>> Checking,Iron & Packings
>> Compacting
>> Computers & Services
>> Couriers
>> Decorators
>> Dyeing
>> Dyes and Chemicals
>> Embroidery
>> Exporter - Non Member
>> Fabrics Manufacturers & Exporters
>> Fire & Safety Equipments
>> Foreign Currency Exchange
>> Home Textiles
>> Hotels
>> Import & Export Consultants
>> Kaja Buttons
>> Knitting
>> Labels
>> Machineries
>> Mobile & Telecom Services
>> Packing Materials
>> Peach Finishing
>> Printing
>> Promoters
>> Service Providers
>> Shipping and Liners
>> Spinning Mills
>> Tapes & Elastics
>> Testing
>> Textile Magazines
>> Trade Mark Consultant
>> Travels Agents
>> Yarn & Threads
Currency Converter


Newly Added Exporters


Newly Added Suppliers


